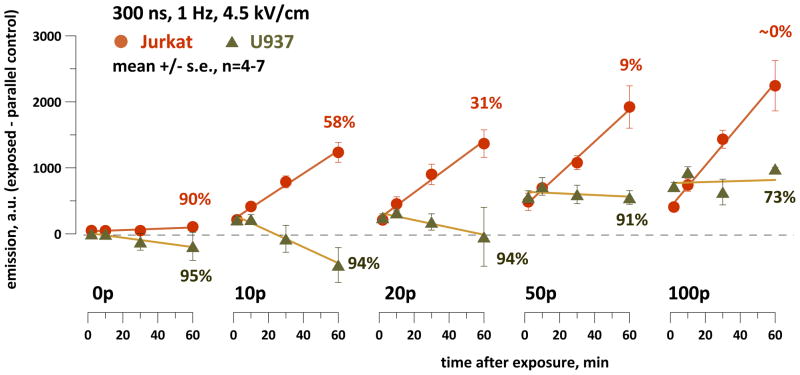
Fig. 3.
Different patterns of ROS formation in nsPEF-treated Jurkat and U937 cells. The vertical axis is the difference in DCF emission between the exposed sample and the time-matched parallel control. Numbers next to the plots indicate the percentage of viable cells as measured by trypan blue exclusion 60 min after nsPEF exposure (n=4; s.e. is within 6% for all datapoints). See Fig. 2 and text for more detail.

