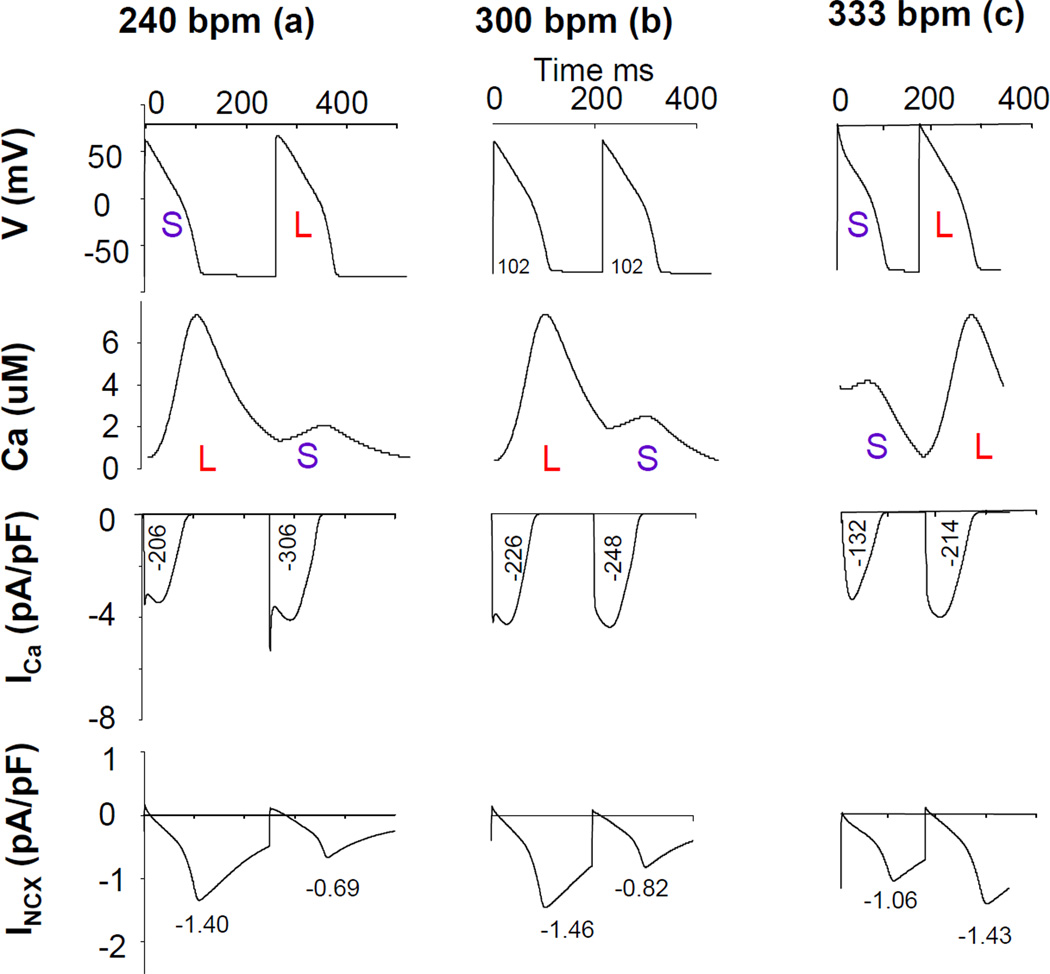
Figure 5. Balanced influence of INCX and ICa on Ca-to-Vm coupling in inhibiting INCX condition.
The figure illustrated the traces of action potential, Ca transient, ICa and INCX at pacing rate of 240 bpm (left), 300 bpm (middle), and 333 bpm (right) in inhibiting INCX (by 80%) as shown in Figure 4 (a, b, c) in computer simulation. The numbers under ICa curves came from the time integration of currents ((pA/pF)*ms), and the numbers under INCX was the peak current density. Ca-to-Vm coupling was negative with inhibited INCX at pacing rate of 240 bpm (left). As pacing rate increased to 333 bpm, Ca-to-Vm coupling was positive (right). However, at pacing rate of 300 bpm, there was large Ca-ALT but virtually no Vm-ALT.

