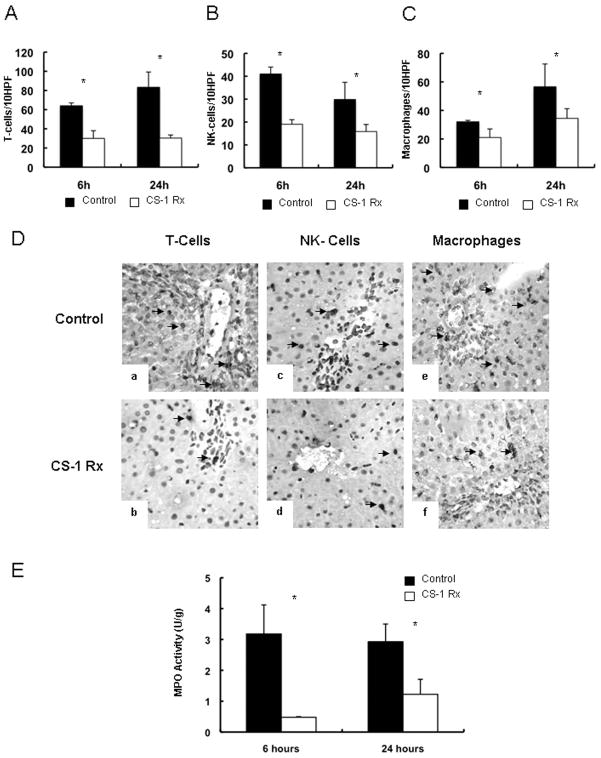
Figure 3.
Leukocyte infiltration in 24h cold liver IRI. The infiltration of T lymphocytes (panel A), NK cells (panel B), and monocyte/ macrophages (panel C) was significantly depressed in CS-1 peptide treated OLTs at 6h and 24h post-reperfusion. Panel D illustrates immunoperoxidase staining of T cells (a, and b), NK lymphocytes (c, and d), and macrophages (e, and f) in CS-1 (b, d, and f) and control (a, c, and e) OLTs at 6h post-transplantation. MPO activity (panel E), an index of neutrophil infiltration, was significantly depressed in CS-1 peptide treated OLTs at 6h and 24h post-transplantation as compared to respective controls (*p<0.05; ×200; n=5–6 rats/group).

