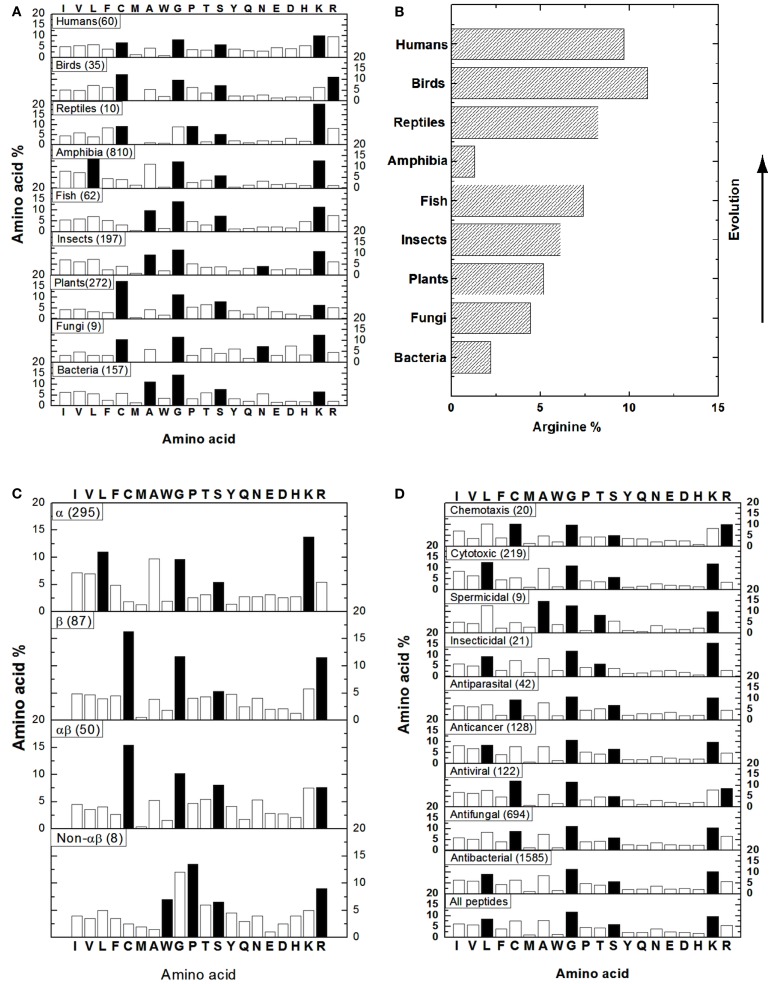
Figure 1.
Amino acid composition analysis of natural AMPs based on source (A,B), structure (C), and activity (D). (B) Shows the arginine percentages of AMPs from different life domains. In each case, the number of peptides included in the bioinformatic analysis is given in parentheses. The solid bars represent the most abundant amino acids in the hydrophobic (I, V, L, F, C, M, A, W), GP (G and P), polar (T, S, Y, Q, N), and charged (E, D, H, K, R) groups. Data were obtained in May 2012 (total peptides: 1973) from http://aps.unmc.edu/AP/main.php by using the search and statistical analysis functions of the APD (Wang et al., 2009).

