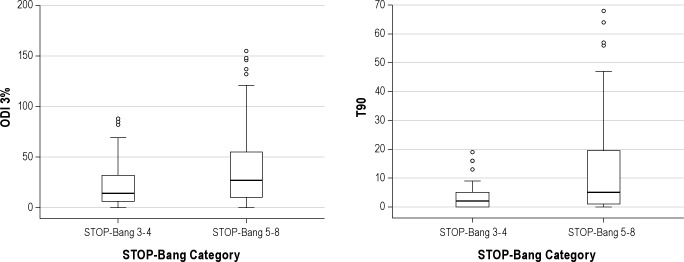
Figure 3. Box plots showing the distribution of and differences in 3% oxygen desaturation index (ODI 3%) and percent of total sleep time below oxygen saturation of 90% (T90) across the two STOP-Bang categories.
Lower and upper boundaries of the box indicate 25th and 75th percentages. A solid line within the box marks the median, and vertical lines indicate the 10th and 90th percentages. Circles are outliers. ODI 3% and T90 were significantly higher in patients with STOP-Bang scores of 5-8 (p = 0.001 and p = 0.003, respectively).

