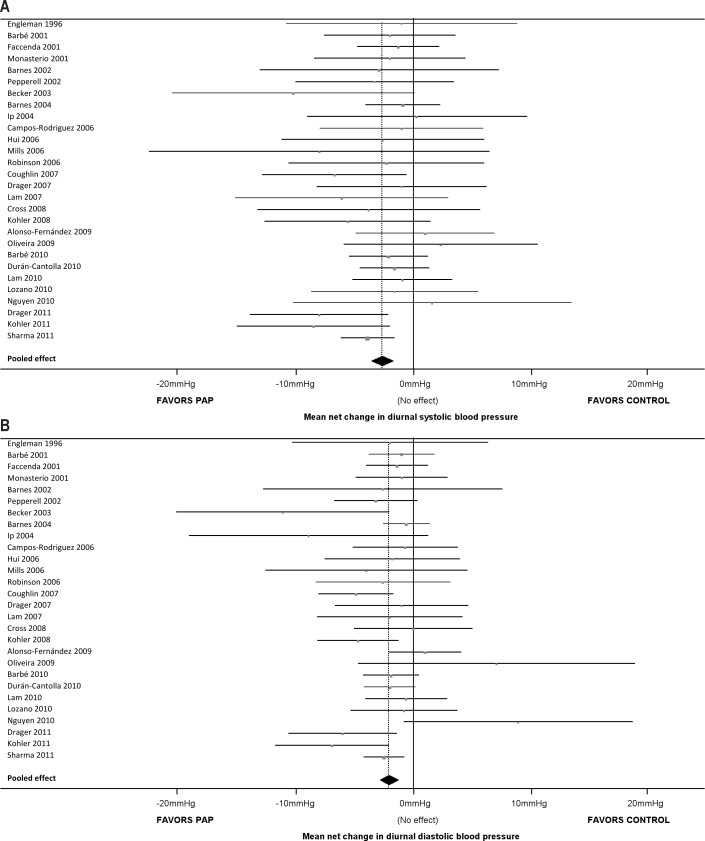
Figure 2. Forest plots comparing the effects of PAP and control on (A) diurnal SBP, and (B) diurnal DBP.
For each study, the square represents the mean difference in blood pressure between PAP and control arms and the width of the line represents the 95% confidence interval; a line crossing the 0 mm Hg vertical line indicates no significant difference at α = 0.05. The diamond summarizes the pooled effect; the apex represents the overall mean difference in diurnal SBP between PAP and control arms, and the width represents the 95% confidence interval. In both plots, the diamond does not cross the 0 mm Hg vertical line, hence there is a significant difference between PAP and control in terms of the change in diurnal SBP (−2.58 mm Hg, p ≤ 0.001) and diurnal DBP (−2.01 mm Hg, p ≤ 0.001). DBP, diastolic blood pressure; PAP, positive airway pressure; SBP, systolic blood pressure.

