
Figure 3. Scatterplots of the weighted mean difference between PAP and control for each study against (A) mean diurnal DBP at baseline, and (B) mean ESS score at baseline.
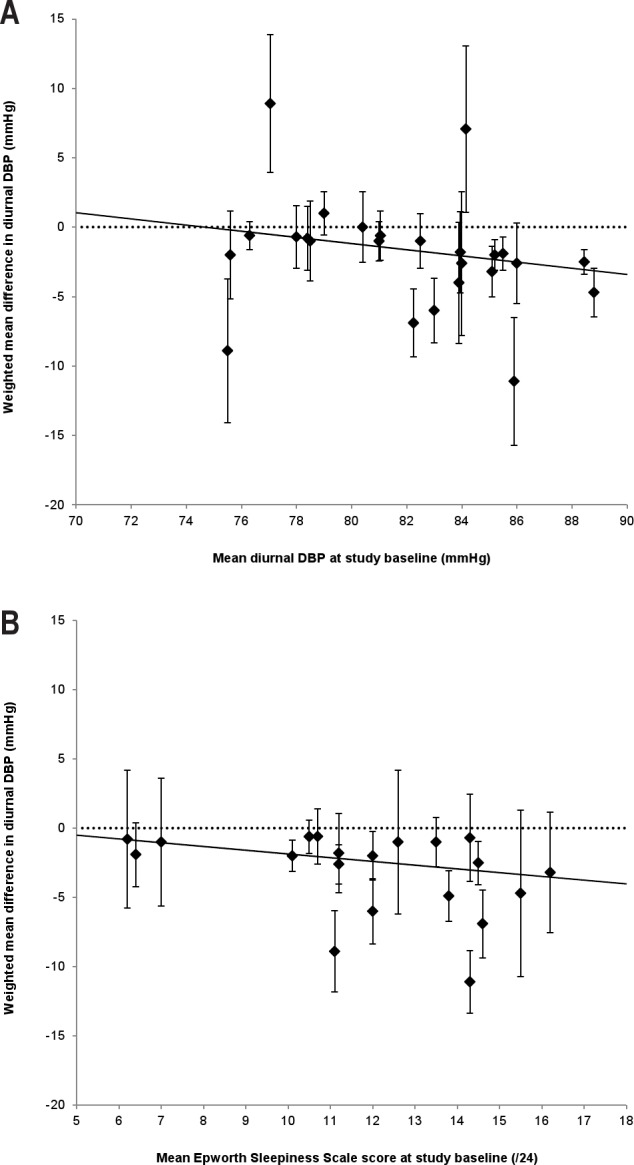
In each plot, the error bars represent the standard error of the mean for each weighted mean difference, the solid lines represent the random effects meta-regression lines, and the dotted lines represent the null effect (0 mm Hg difference between PAP and control). The analysis in (A) suggests that the mean difference in diurnal DBP between PAP and control would decrease by 2.22 mm Hg with every increase of 10 mm Hg diurnal DBP at baseline (β = −0.22, p = 0.02), while the analysis in (B) suggests that the mean difference in diurnal DBP between PAP and control would decrease by 1.35 mm Hg with every 5-point increase in ESS score at baseline (β = −0.27, p = 0.04). DBP, diurnal blood pressure; ESS, Epworth Sleepiness Scale.