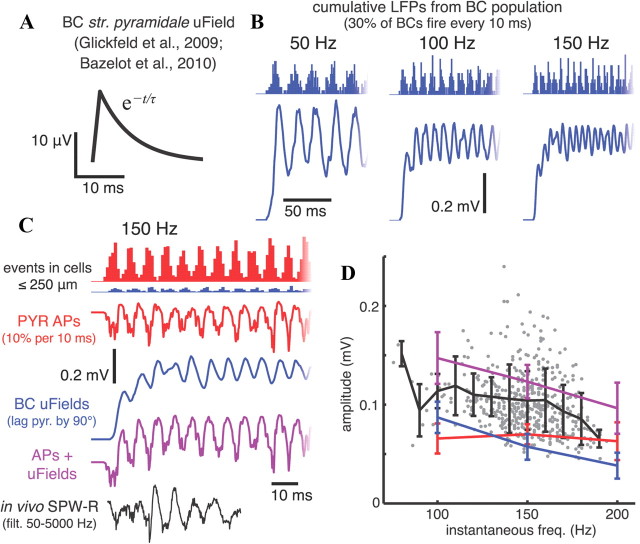
Figure 10.
APs and IPSCs contribute similar amounts of power to 100–200 Hz SPW-R LFPs. A, uField in stratum pyramidale from a single basket cell (BC) spike, modeled after uFields measured by Glickfeld et al. (2009) and Bazelot et al. (2010). B, Cumulative LFPs in a rhythmically firing basket cell population when the uField in A is added at the time of each spike for basket cells within 250 μm of the electrode contribute uFields; 30% of the population spikes each 10 ms. Histograms above the LFP curves indicate spike times. C, Comparison of simulated LFPs from pyramidal cell EAPs (red) during a 150 Hz population rhythm with 10% spiking each 10 ms (as in Fig. 6), basket cell uFields (blue), the two combined (magenta) with the basket cell spiking rhythm lagging the pyramidal cell rhythm by 90° (Sullivan et al., 2011), and a 50–5000 Hz bandpass filtered SPW-R recorded in vivo (black). The histogram shows all events occurring in cells within 250 μm from the electrode; the potentials include pyramidal cell EAPs from all cells within 500 μm and basket cell uFields from all cells within 250 μm of the electrode (see Materials and Methods and Results). D, Comparison of amplitudes for in vivo and simulated ripples. The gray dots show instantaneous amplitudes and frequencies of individual troughs within in vivo fast oscillation events between 50 and 210 Hz (see Materials and Methods), the black line marks the mean (±SD) trough amplitudes in 10 Hz bins of these in vivo ripple waves, and colored lines (same colors as in C) indicate mean (±SD) trough amplitudes during simulated ripples in populations oscillating at 100, 150, and 200 Hz.

