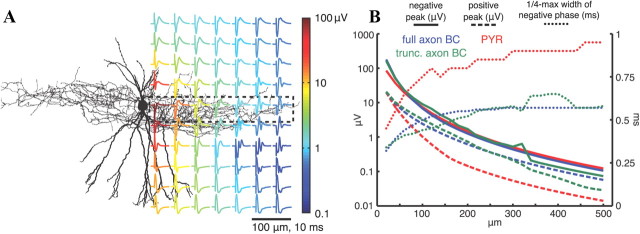
Figure 7.
Spatiotemporal characteristics of basket cell EAPs. A, Location dependence of EAPs for the single basket cell model with peak-to-peak voltage range indicated by the color of each trace. As in Figure 1, subthreshold currents have been removed, and each trace is an average over 25 points at a fixed radius around the vertical dendritic axis. B, EAP amplitude and width versus distance for the cell models: blue, pyramidal cell (PYR); purple, basket cell (BC); orange, basket cell with axon truncated at 68 μm. The amplitude of the negative (solid lines) and positive (dashed lines) peaks correspond to the left axis, and the width of the negative phase (dotted lines) corresponds to the right axis.

