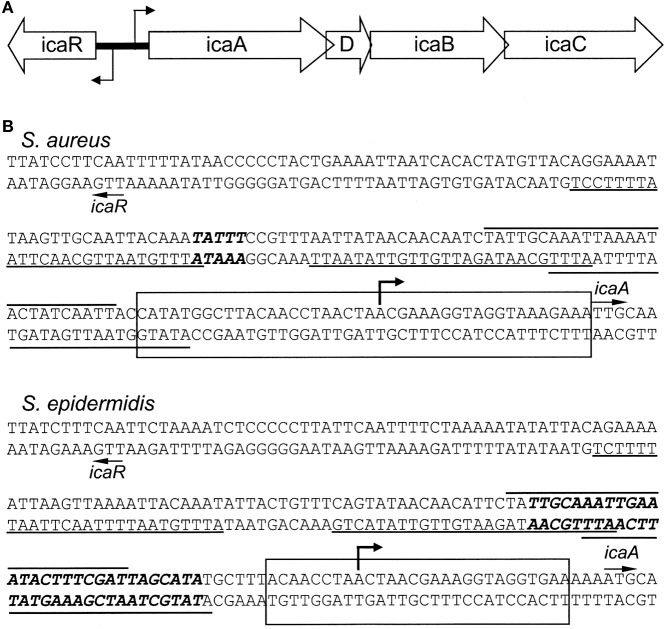
Figure 1.
(A) Organization of the intercellular adhesion (ica) operon in S. aureus and S. epidermidis. The bent arrows indicate the transcriptional start sites. (B) The icaR-to-icaA intergenic regions. The start sites of icaR and icaA are indicated by arrows. The putative binding sites for the SarA protein are underlined or overlined (Tormo et al., 2005). The bent arrow indicates the icaADBC transcription start site determined for S. epidermidis RP62A; (Heilmann et al., 1996b; Mack et al., 2000). Top: Sequence of the S. aureus NCTC 8325 ica locus (Gillaspy et al., 2006). The bold, italicized nucleotides indicate base pairs deleted in S. aureus MN8m that resulted in PIA/PNAG overproduction (Jefferson et al., 2003). The rectangle indicates the region bound by IcaR in DNase I protection experiments (Jefferson et al., 2003). Bottom: Sequence of S. epidermidis RP62A ica locus (Heilmann et al., 1996b). The bold, italicized nucleotides represent the highest affinity TcaR binding site (Chang et al., 2010). The rectangle indicates the IcaR binding site (Jeng et al., 2008).

