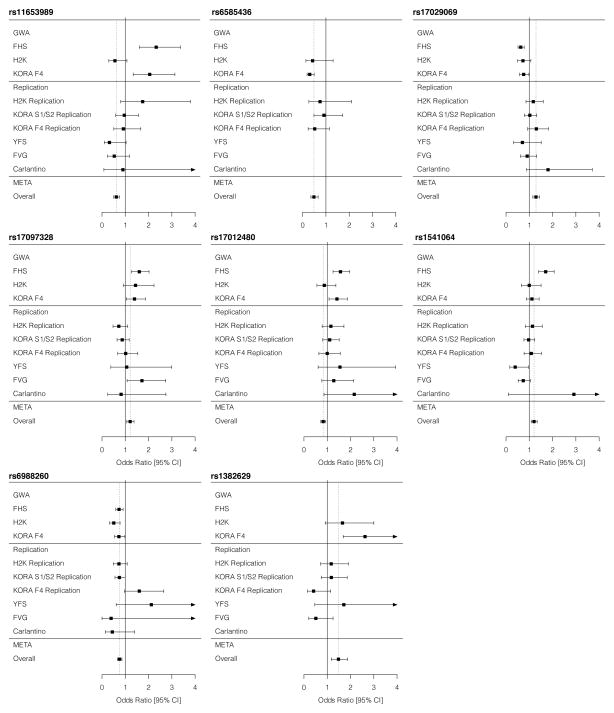
Figure 2. Association results by cohort for SNPs selected for replication.
For each SNP we attempted to replicate, ORs and 95% CIs are plotted by cohort and for the meta-analyzed results. For each SNP panel, the upper section represents cohorts included in the GWAS stage, the middle section those included in the replication stage, and the lower section depicts meta-analysis results. CI – confidence interval; META – meta-analysis; OR – odds ratio.

