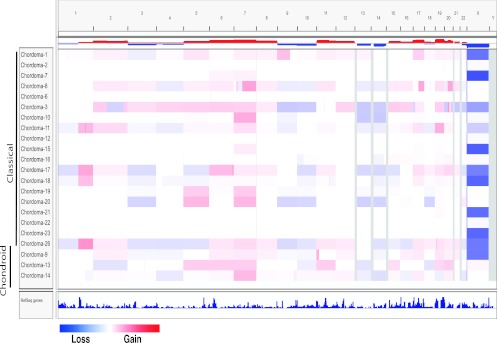
Figure 2.
Genomic imbalances detected in individual tumor samples. Gains (red) and losses (blue) of genomic material were detected in all tumor samples by SNP array analysis. Each row corresponds to a unique sample and each column represents a specific chromosome. Chondroid and classic chordoma samples have been grouped to facilitate comparison. Note the acquisition of chromosome 3 loss and the similarity of gains and losses in the recurrent tumor sample (CHD20) to the primary tumor sample (CHD19).

