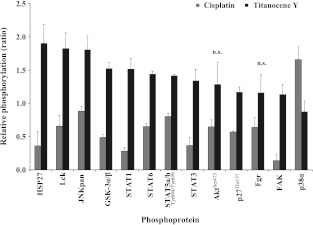
Figure 5.
Relative levels of protein phosphorylation (ratios of phosphorylation of treated cells/untreated cells) for the panel of proteins exhibiting opposing modification in response to either cisplatin or Titanocene Y in NCI-H526 cells. With exception of p38α MAPK, all proteins revealed increased phosphorylation in response to Titanocene Y, whereas cisplatin yielded decreased or unchanged phosphorylation (all differences significant, except for Akt-Ser473 and Fgr). Phosphorylation levels of all proteins were different from a ratio r = 1.0, with exception of JNKpan for cisplatin and p38α MAPK for Titanocene Y, respectively.

