Figure 9.
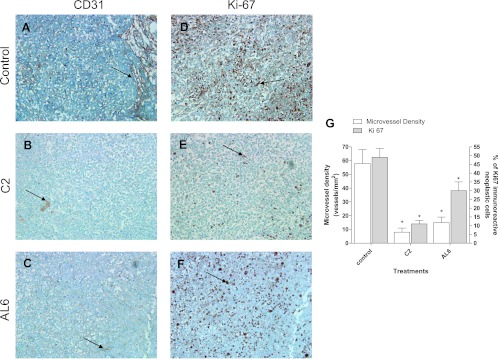
Representative images of immunohistochemistry of mouse microvessel density in MIA PaCa-2 xenografts in (A) vehicle-treated mice (control group) and (B) in metronomic C2-treated and (C) metronomic AL6-treated mice. Representative images of immunohistochemistry of Ki67 in MIA PaCa-2 xenografts in (D) vehicle-treated mice (control group) and in (E) metronomic C2 and (F) metronomic AL6 groups of mice. Arrows point to positively stained cells. Original magnification, x200. (G) Quantification of microvessel density and Ki67 immunostaining in MIA PaCa-2 tumor xenografts treated with vehicle alone, metronomic C2, or metronomic AL6, at the end of the in vivo experiment. Columns and bars, mean values ± SD, respectively. *P < .05 versus vehicle-treated controls.

