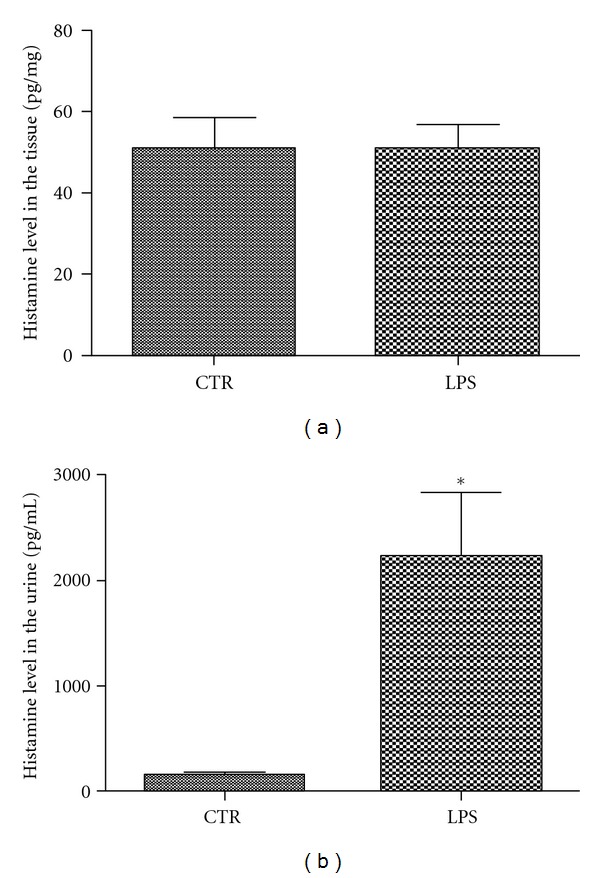
Figure 2.

ELISA results for histamine analysis. (a) Histamine levels in bladder tissues of the Model group (n = 6) show no significant difference with those of the Control group (n = 3) (P = 0.796). (b) Histamine levels were significantly elevated in urine from the Model group compared with the Control group (P < 0.05).
