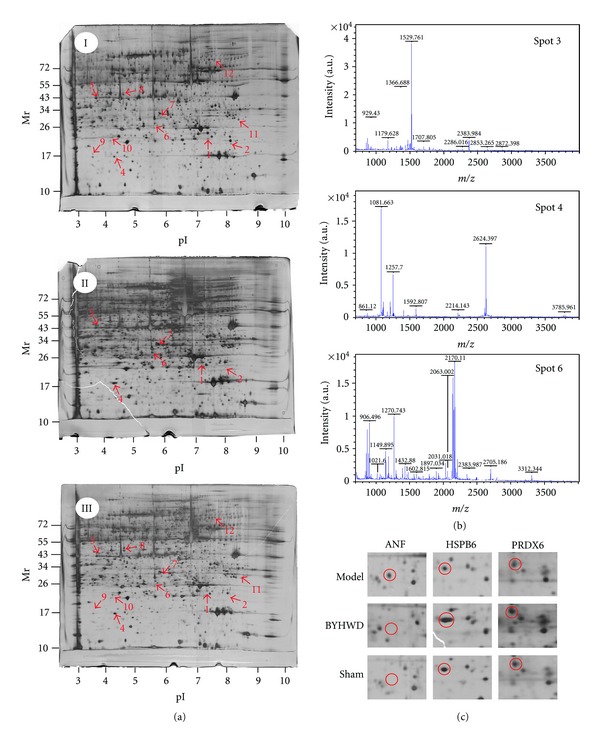
Figure 2.

2D gel images of protein expression and MALDI-TOF MS identification of samples from area at risk in rat left ventricle. (a) 2D gel images of protein expression. Figure “I” was from model rats, Figure “II” was from BYHWD rats, and Figure “III” was from sham rats. (b) MALDI-TOF MS was obtained from spot 3, spot 4, and spot 6 after trypsin digestion. (c) Magnified images of spot 3 (ANF), spot 4 (HSPB6), and spot 6 (PRDX6).
