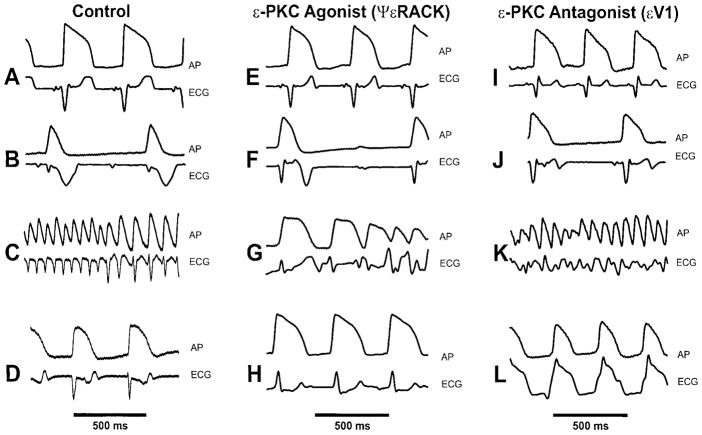
Figure 2. Action potentials and electrocardiograms from guinea pig hearts.
Action potentials and ECGs were recorded from untreated control, εPKC agonist ψεRACK and εPKC antagonist hearts. In the control, (A) represents recordings at 30 min stabilization period, (B) at 15 min global ischemia, (C) at 10 sec of reperfusion with an onset of ventricular fibrillation (VF) and (D) at 20 min reperfusion demonstrating partial recovery of action potentials. In the εPKC agonist ψεRACK (0.5 μM), (E) represents recordings at 30 min stabilization period, (F) at 15 min global ischemia, (G) at 30 seconds reperfusion with self terminated ventricular tachycardia (VT) and (H) at 20 min reperfusion demonstrating full recovery of action potentials. In the εPKC antagonist εV1 (0.5 μM), (I) represents recordings at 30 min stabilization period, (J) at 15 min global ischemia, (K) at 20 seconds reperfusion showing VT and (L) at 20 min reperfusion demonstrating poor recovery of action potential and ECG with VT still present.

