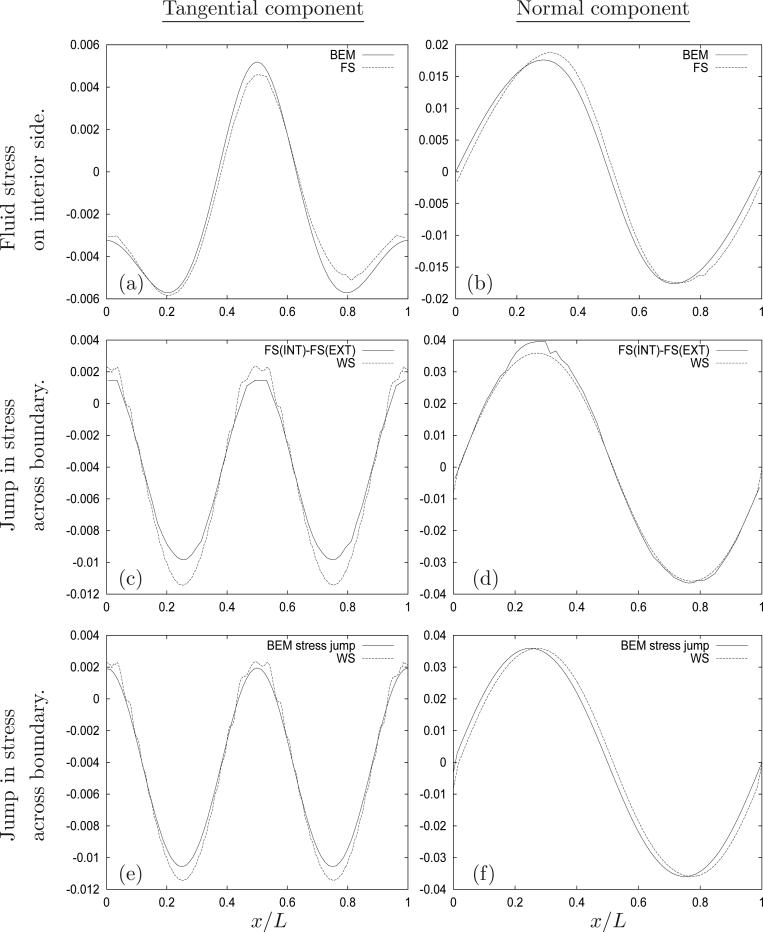
Figure 7.
A comparison for each of the two orthogonol components of stress (kg · m–1 · s–2 ) calculated using the IBM at t = 7.5s (after two complete cycles) with results from the BEM on the lower boundary. In (a,b) the fluid stress evaluated on the interior side of the immersed boundary is compared with the BEM prediction. In (c,d) the IMBM prediction of fluid stress jump across the wall is compared with the WS prediction. In (e,f) the BEM prediction of the fluid stress jump is compared with the WS. The IMBM results were computed using a 256 × 256 grid.

