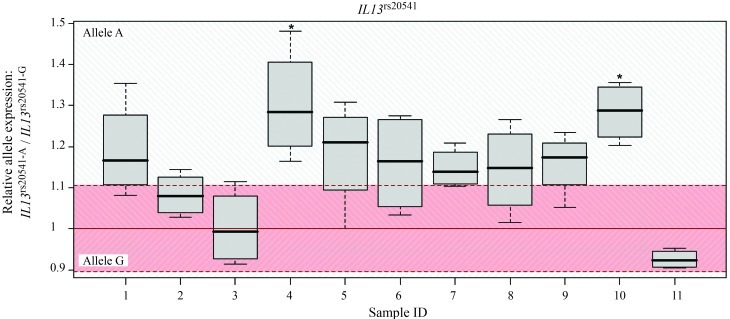
Figure 2.
Differential cis-directed expression in samples heterozygous for IL13rs20541. Boxplots show the allelic expression in individual samples; horizontal lines indicate the median and whiskers indicate the 1.5 x interquartile range. The minor allele is A (Q, glutamine) and the major allele is G (R, arginine). The gDNA fluctuation range (mean ± 1.96 SD) is indicated in red and represents the range (defined in the Methods) in which there is no differential allelic expression. Allelic ratios were calibrated relative to the mean for gDNA samples, which corresponded to an allelic ratio of 1. *p < 0.05. SNR – signal-to-noise-ratio.

