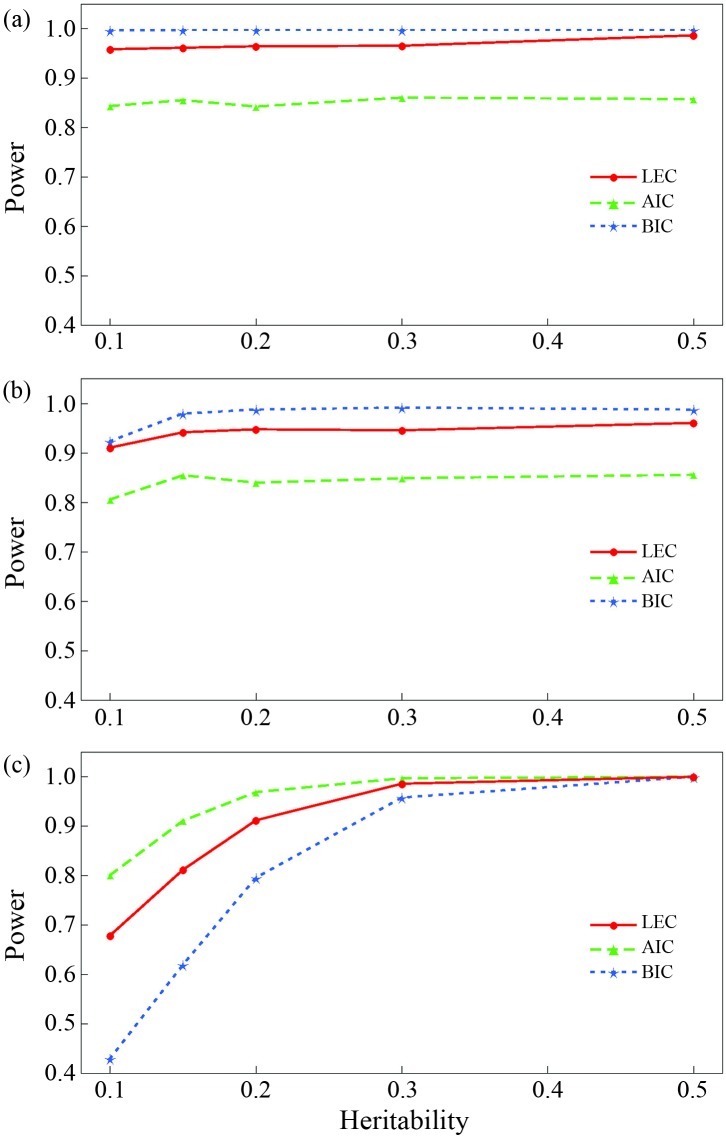
Figure 1.
Comparison of the powers for model selection using different criteria and the QTL segregation pattern associated with (a) test cross, (b) F2 cross and (c) full cross. Power was estimated as the number of runs out of 1000 replicates in which the correct model was chosen using LEC, AIC and BIC.

