
Figure 3.
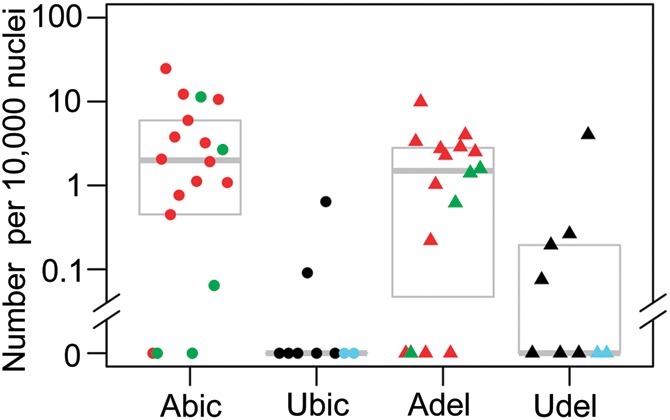
The total numbers of DUX4-FL expressing nuclei are significantly higher in myogenic cultures from affected (A) versus unaffected (U) subjects. Counts of DUX4-FL positive nuclei, determined by ICC, per 10 000 nuclei are shown. From left to right, columns show FSHD biceps (A.bic, n= 18, including 5 asymptomatic in green), unaffected biceps (U.bic, n= 9, including 2 4qB/4qB in blue), FSHD deltoid (A.del, n= 16, including 4 asymptomatic in green), and unaffected deltoid samples (U.del, n= 9 including 2 4qB/4qB in blue). Gray boxes show range from 25th percentile to 75th percentile, with the median shown as a bold grey line. Within each column, samples are ordered by increasing length of shortest 4qA EcoRI/BlnI fragment, with 4qB/4qB haplotypes at far right (ties broken arbitrarily). The difference between affected and unaffected samples is highly significant (p = 0.001; likelihood-ratio test), the difference between muscle types is non-significant (p = 0.4), and the interaction between muscle type and disease status is mildly significant (p = 0.03). (All P-values exclude the 4qB/4qB samples, which lack DUX4-FL permissive alleles.)