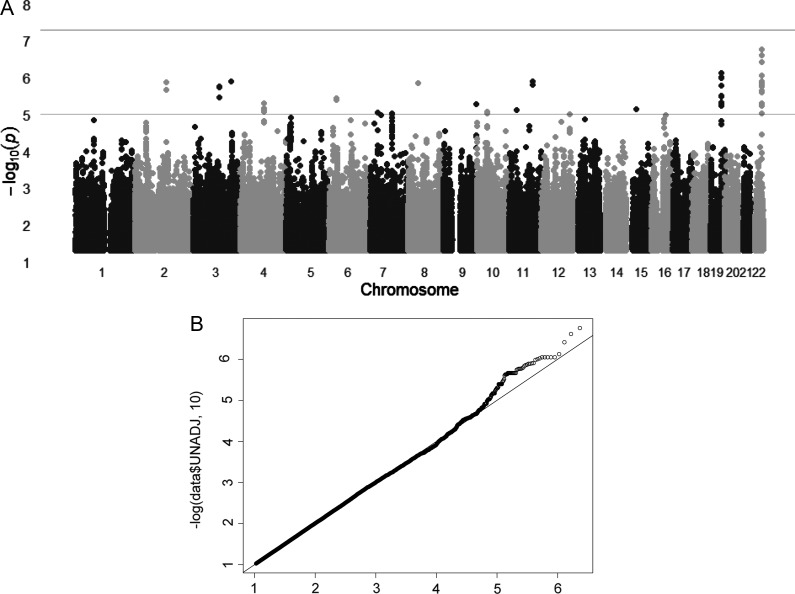
Figure 4.
The Manhattan plot and the Q–Q plot for the GWAS for CSF APOE levels. (A) Within each chromosome, shown on the x-axis, the results are plotted left to right from the p-terminal end. Horizontal dashed lines indicate P-value thresholds of 1 × 10⁻⁵ and 5 × 10⁻⁸ (genome-wide significance). (B) Quantile–quantile (Q–Q) plot. No evidence of systematic inflation of P-values was found (λ = 1.007). The plots compare additive model statistics to those expected under the null distribution using fixed-effects for all analyzed imputed SNPs passing quality control criteria in the studies.

