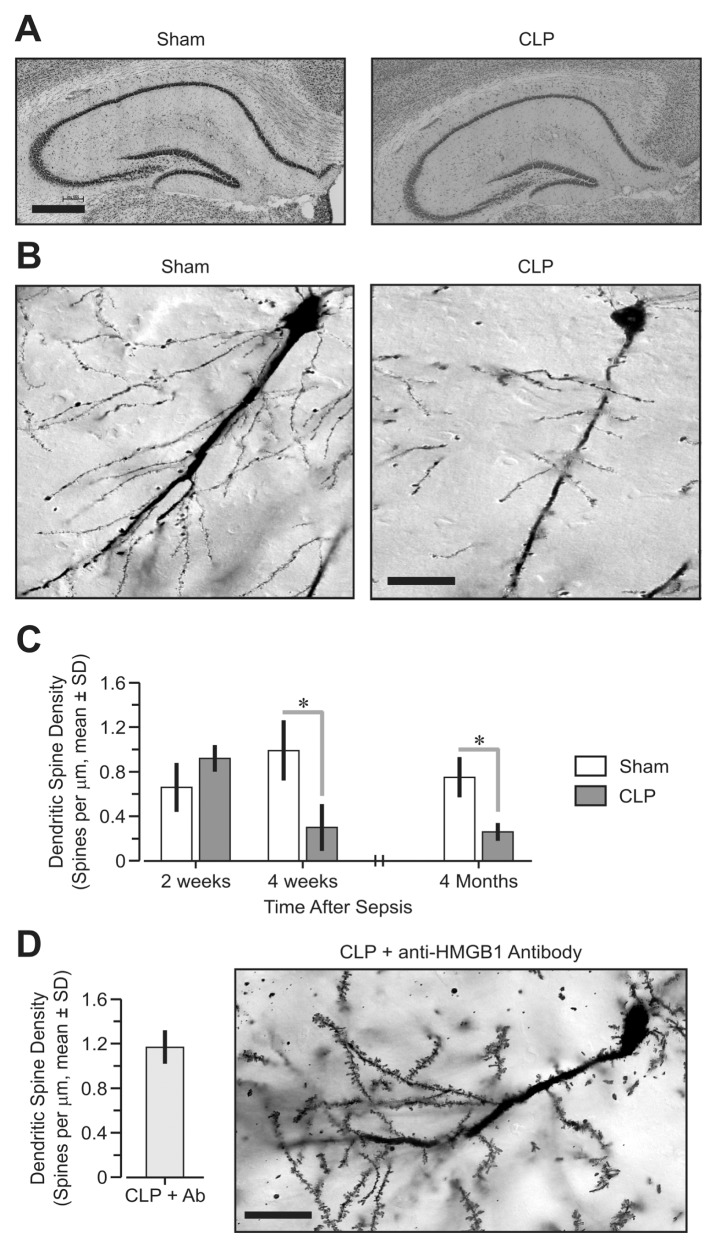
Figure 5.
Neuroanatomical assessments in the hippocampus. (A) Representative cresyl violet-stained sections showed no gross abnormalities in the hippocampus of CLP mice when compared with sham surgery mice. (B) Golgi staining of CA1 neurons in the hippocampus, 4 wks after CLP or sham surgery (bar, 500 μm). (C) Quantification of CA1 apical dendritic spine density (spines per μm, mean ± SD) at 2 wks, 4 wks and 4 months after CLP or sham surgery. The sham group had significantly more spines at the later time points (*P < 0.05, three to four mice in each group; three to six dendritic arbors from each animal). (D) Mice that were treated with anti-HMGB1 antibody (Ab) following CLP exhibited a density of dendritic spines comparable to sham animals, 4 wks after surgery (three animals, six dendritic arbors from each animal). At right, Golgi–stained section of CA1 neuron from a CLP animal that was treated with anti-HMGB1 Ab (bar, 50 μm).

