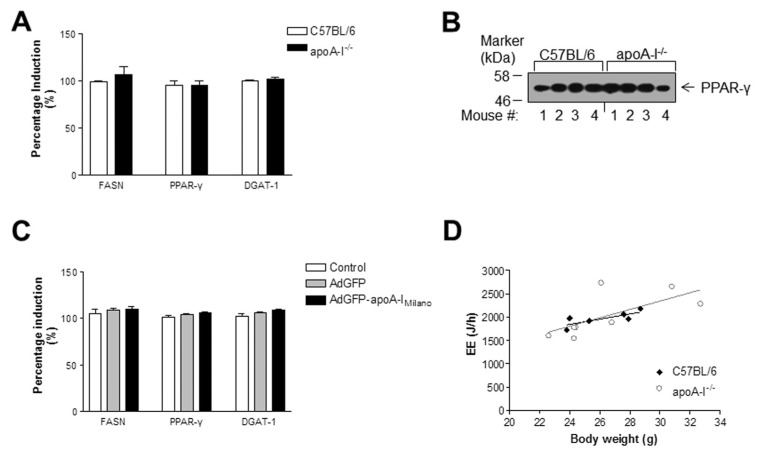
Figure 3.
Expression levels of lipogenic genes and indirect calorimetry analysis. (A) Relative mRNA expression of FASN, PPARγ and DGAT-1 genes. (B) Protein levels of hepatic PPARγ in the livers of C57BL/6 and apoA-I−/− mice fed a Western-type diet for 24 wks. (C) Relative mRNA expression of FASN, PPARγ and DGAT-1 in untreated apoA-I−/− mice or apoA-I−/− mice treated with the apoA-IMilano–expressing or a control AdGFP adenovirus. Error bars indicate the standard error of the mean. (D) Linear regression plot of EE (J/h) versus mouse body weight (g) for the C57BL/6 and apoA-I−/− mouse groups.

