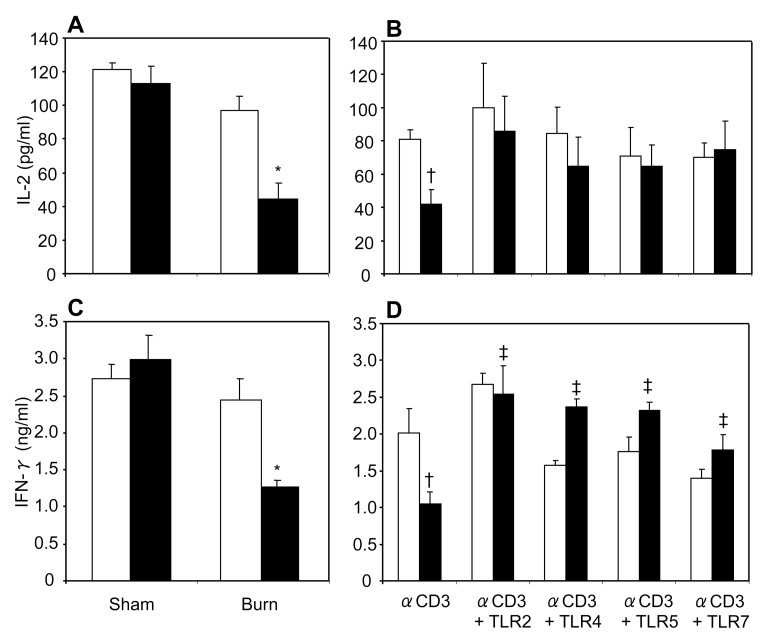
Figure 2.
MLN T-cell IL-2 and IFN-γ production. MLN T cells (5 × 10⁶/mL) collected from various experimental groups were cultured with plate-bound anti-CD3 (2 μg/mL) for 48 h, and supernatants were collected to determine IL-2 (A) and IFN-γ (C) production. White bars indicate vehicle treatment, black bars indicate ethanol treatment. To determine the effects of TLR agonists, MLN T cells (5 × 10⁶/mL) were cultured with plate-bound anti-CD3 antibody (2 μg/mL) in the presence or absence of TLR agonists: TLR2, HKLM (108 cells/mL); TLR4, LPS (1 μg/mL); TLR5, ST-FLA (1 μg/mL) and TLR7, ssRNA40 (1 μg/mL) for 48 h. Supernatants were collected to determine IL-2 (B) and IFN-γ (D) production. White bars indicate sham vehicle, black bars indicate burn ethanol. Values are means ± SEM from five to six animals/group, except the CD3+ TLR4 group, which had three animals. *P < 0.05 compared with other groups; †P < 0.05 compared with sham vehicle without TLR agonists; ‡P < 0.05 compared with burn EtOH without TLR agonists.

