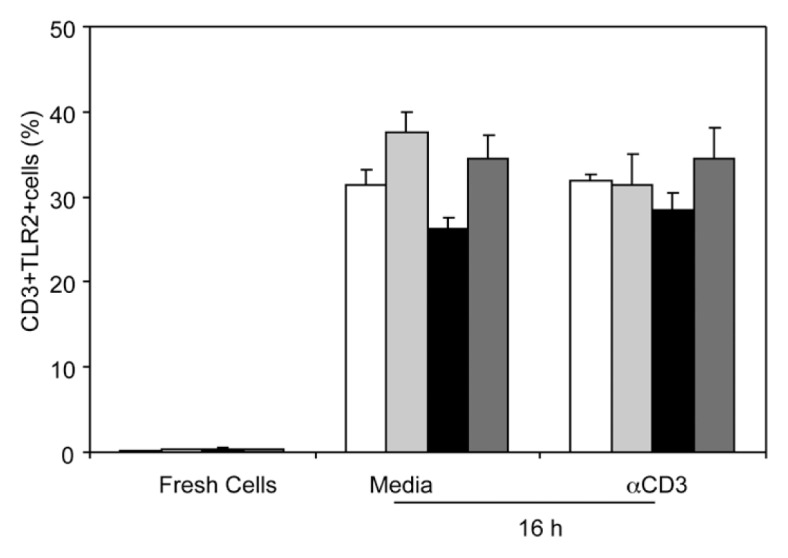
Figure 5.

T-cell TLR2 expression. Fresh spleen T cells (106 cells/100 μL) or T cells cultured in the presence or absence of plate-bound anti-CD3 for 16 h were collected and stained with RPE-Cy5–conjugated anti-CD3e and Alexa Fluor-647–conjugated anti-TLR2. Expression of CD3 and TLR2 were determined by flow cytometery. Values are means ± SEM from three to five animals/group. White bars indicate sham vehicle, light gray bars indicate sham ethanol, black bars indicate burn vehicle, dark gray bars indicate burn ethanol.
