
Figure 2.
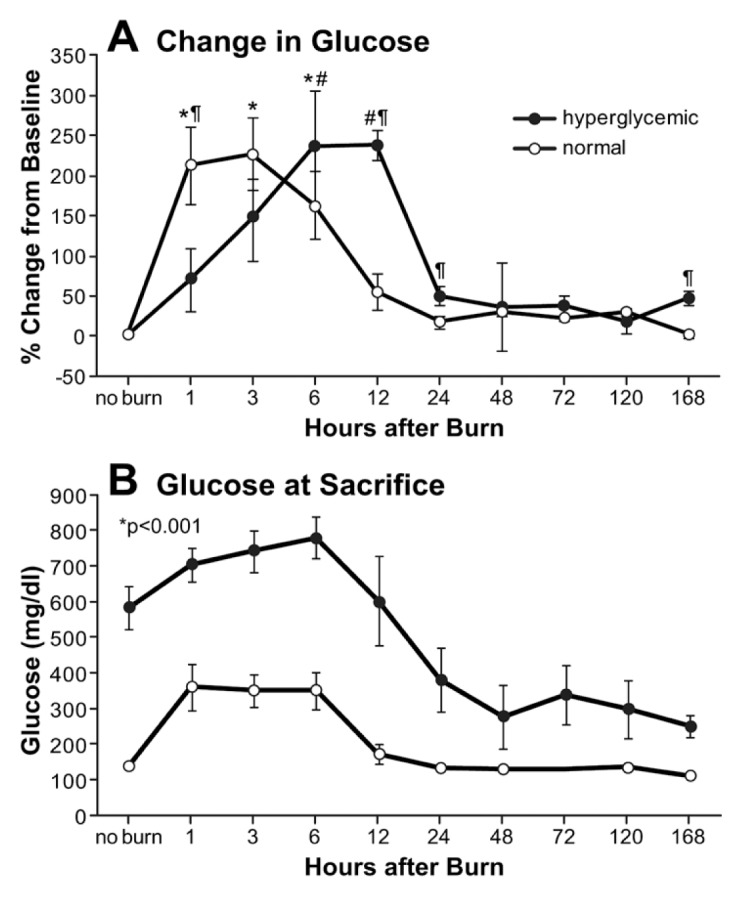
Changes in serum glucose after burn (A). Glucose was measured in a serum sample at the time of euthanasia using a VetScan 2 instrument (B). Each time point represents n = 5–10 separate animals per experimental group. Data from hyperglycemic and control groups were compared over time by two-way ANOVA. Changes within each group were analyzed by one-way ANOVA with post hoc correction and compared with sham, no burn (* for hyperglycemic group and # for control group). Differences in change in glucose at each time point between hyperglycemic and control animals were analyzed by Tukey t test (¶).