
Figure 3.
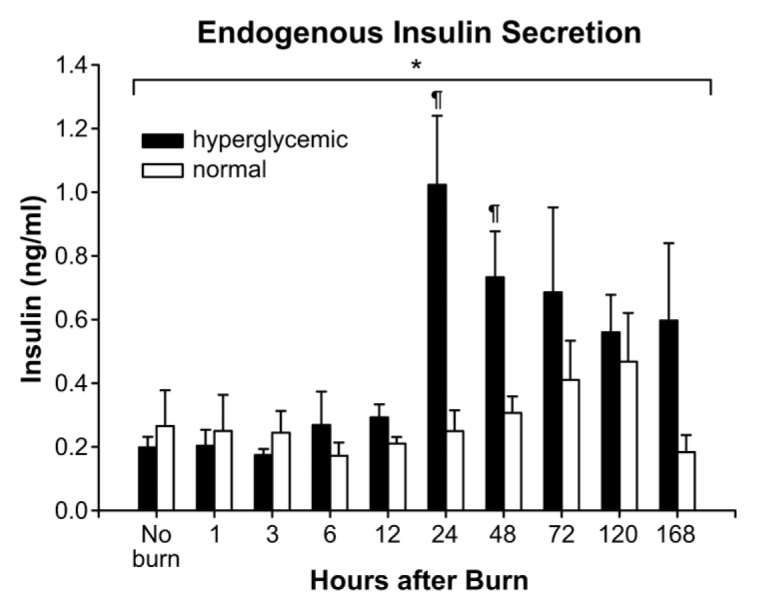
Endogenous insulin at time of euthanasia. Insulin levels were measured in the serum from blood collected at euthanasia by ELISA. Each time point represents n = 5–10 separate animals per experimental group. Data from hyperglycemic and control groups were compared over time by two-way ANOVA (*). Changes within each group were analyzed by one-way ANOVA with post hoc correction and compared with sham, no burn (¶ for hyperglycemic group).