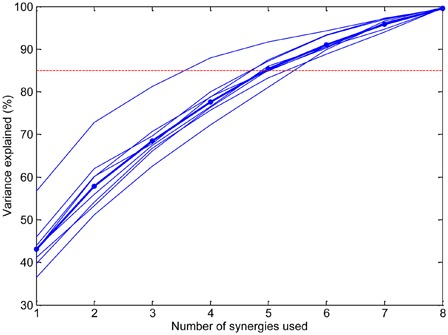
Figure 2.

Percentage of signal variance explained as a function of the number of synergies. The dotted line shows the threshold used (85%) for choosing the number of synergies. The thin lines correspond to individual able-bodied subjects and the thick line shows the mean.
