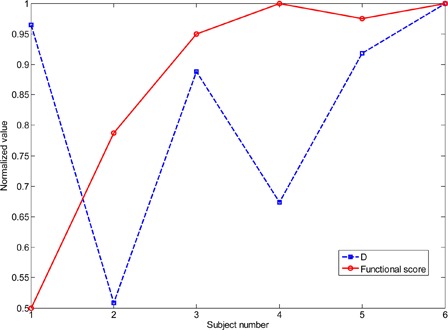
Figure 4.

Difference D of each SCI subject's muscle synergies from the average able-bodied synergies show in Fig. 3 (dotted line; see text for details of how D is computed), as well as each SCI subject's functional score (solid line). The series of D values is normalized to its largest entry and the functional scores are normalized to the maximum possible score (40).
