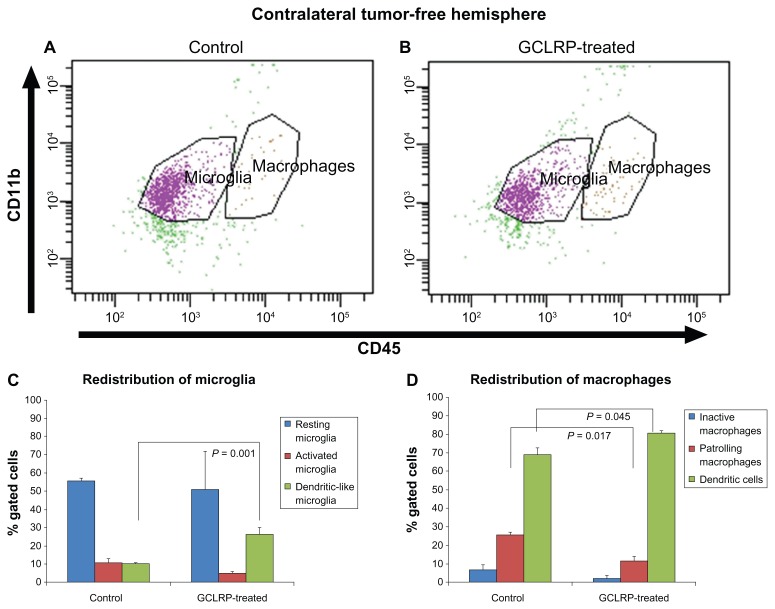
Figure 12.
Dot-plots represent populations of the CD115+ cells in controls and GCLRP-treated animals. Dot-plots represent populations of the CD115+ cells in controls (A) and GCLRP-treated animals (B) in the contralateral tumor-free hemisphere. (C) In the contralateral tumor-free hemisphere GCLRP treatment was associated with proportional increase in the DLMi. (D) Administration of GCLRP was associated with proportional decreased PMa population whereas an increase was found in the DC population as compared to controls.
Abbreviations: CD, cluster of differentiation; GCLRP, peptide mimetic of a ligand of C-type lectin receptor; DLMi, dendritic-like microglia; PMa, patrolling macrophages; DC, dendritic cell.

