Figure 9.
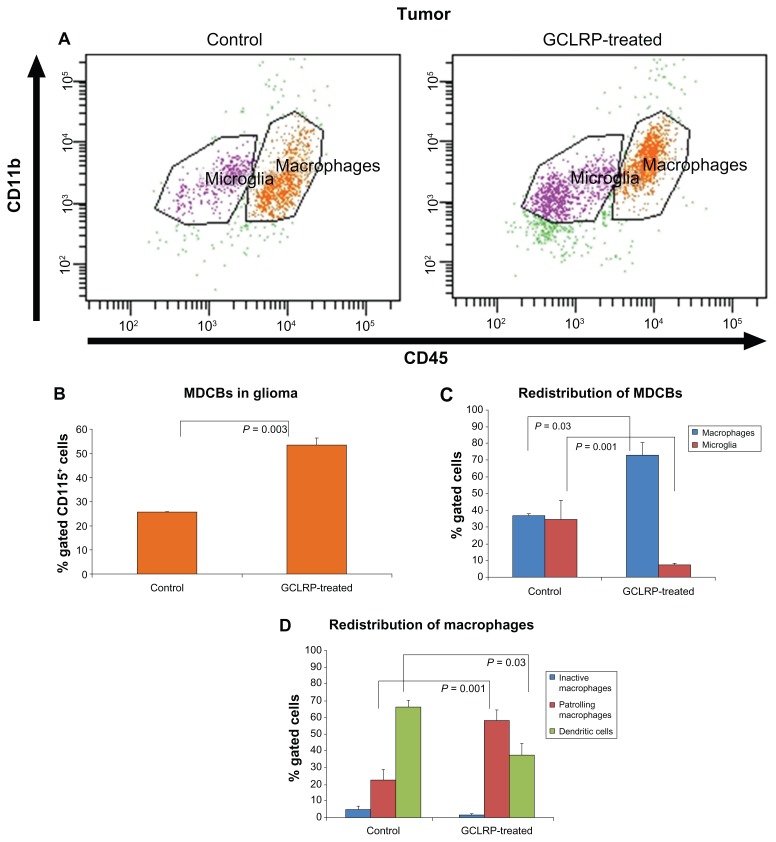
FACS analysis of MDCBs within the glioma. (A) Dot-plots represent population of the CD115+ cells in control and GCLRP treated animals. Analysis of MDCB within glioma; (B) GCLRP treatment was associated with increased MDCBs within glioma; (C) proportional redistribution of microglial and macrophagal populations in the tumor area under GCLRP treatment; and (D) proportional redistribution of macrophagal subsets where DCs predominated in control samples, but PMa predominated in GCLRP treated samples.
Abbreviations: FACS, fluorescence-activated cell sorting; MHCII, major histocompatibility complex; MDCBs, monocyte-derived cells of the brain; CD, cluster of differentiation; GCLRP, peptide mimetic of a ligand of C-type lectin receptor; DCs, dendritic cells; PMa, patrolling macrophages.

