
Figure 1.
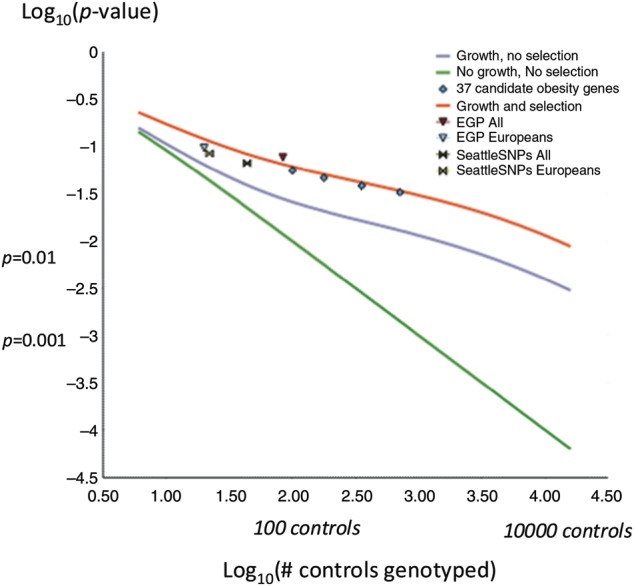
The Probability that a non-pathogenic variant observed in a single patient would not be observed in multiple controls. Log–log scale plot is shown for theoretical model assuming constant population and no natural selection (27) (green line); population genetic model assuming recent population growth and no natural selection (40) (blue line); population genetic model that incorporates both population growth and natural selection (40) (red line). Results of theoretical models are shown together with estimates based on real data obtained by re-sampling from three available systematic re-sequencing data sets [Environmental Genome Project data set (78), Seattle SNP data set (78) and Obesity Sequencing Study data set (27)].