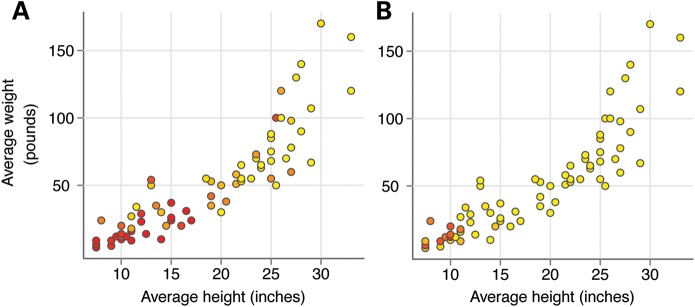
Figure 2.
Correlation of the allele frequency and size at IGF1 and IGF1R loci. The average height and weight of breeds from the CanMap dataset are plotted (3). Each circle represents one breed. The ancestral allele frequency is represented as a gradient from red (low) to yellow (high). SNPs depicted include CFA15:44,226,659 (A) and CFA3:43,756,620 (B). These SNPs are highly associated with canine body size at IGF1 and IGF1R loci, respectively (3,31).

