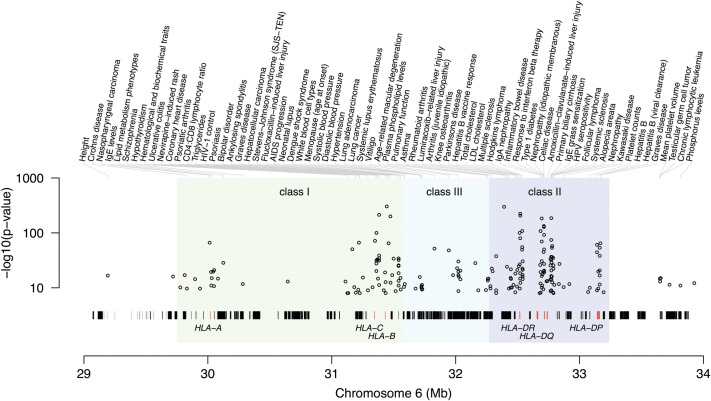
Figure 1.
Overview of the MHC region with validated GWAS associations from the NHGRI GWAS catalog (http://www.genome.gov/gwastudies/) plotted as a function of position along chromosome 6 (hg18). Strongest SNP associations are annotated by trait or disease. Classical HLA-A, -B, -C, -DP, -DQ and -DR genes are highlighted (red vertical ticks) among the many hundreds of genes across the region.

