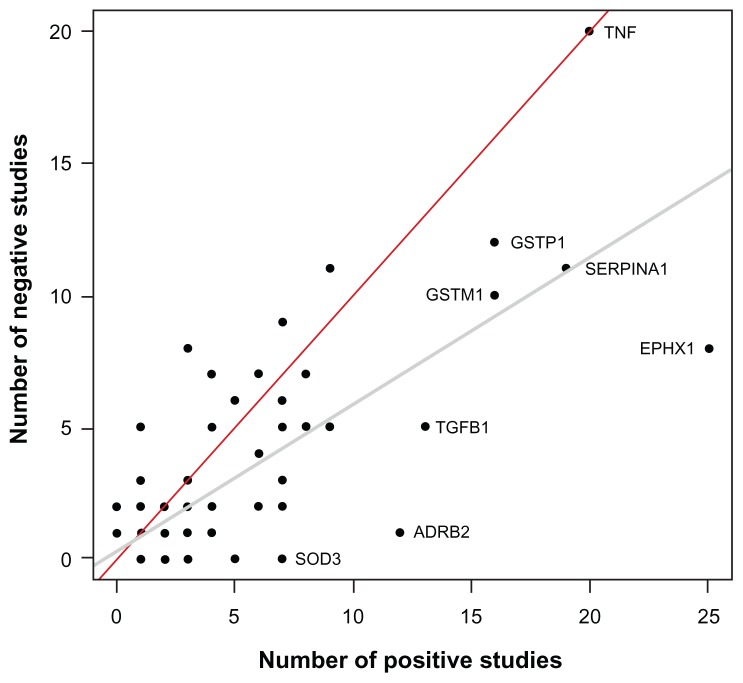
Figure 2.
Scatter plot showing the number of studies supporting and not supporting candidate genes for chronic obstructive pulmonary disease.
Notes: A total of 192 genes are illustrated. Note that many genes overlap in the lower-left corner and the 192 dots cannot be visualized on this display. The gray and red lines are the regression and identity lines, respectively. Genes studied many times or more consistently replicated are illustrated.

