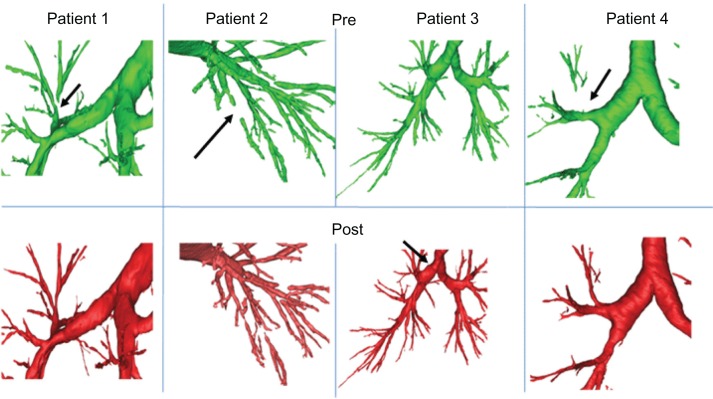
Figure 2.
Examples of the comparison of individual airways in different COPD patients as assessed with 3D CT analyses at baseline and after intrapulmonary percussive ventilation (IPV) treatment.
Notes: The upper panels show local airways in different COPD patients as measured at baseline and the bottom panels show the same airways as assessed after IPV treatment. Arrows indicate significant changes in airway patency.

