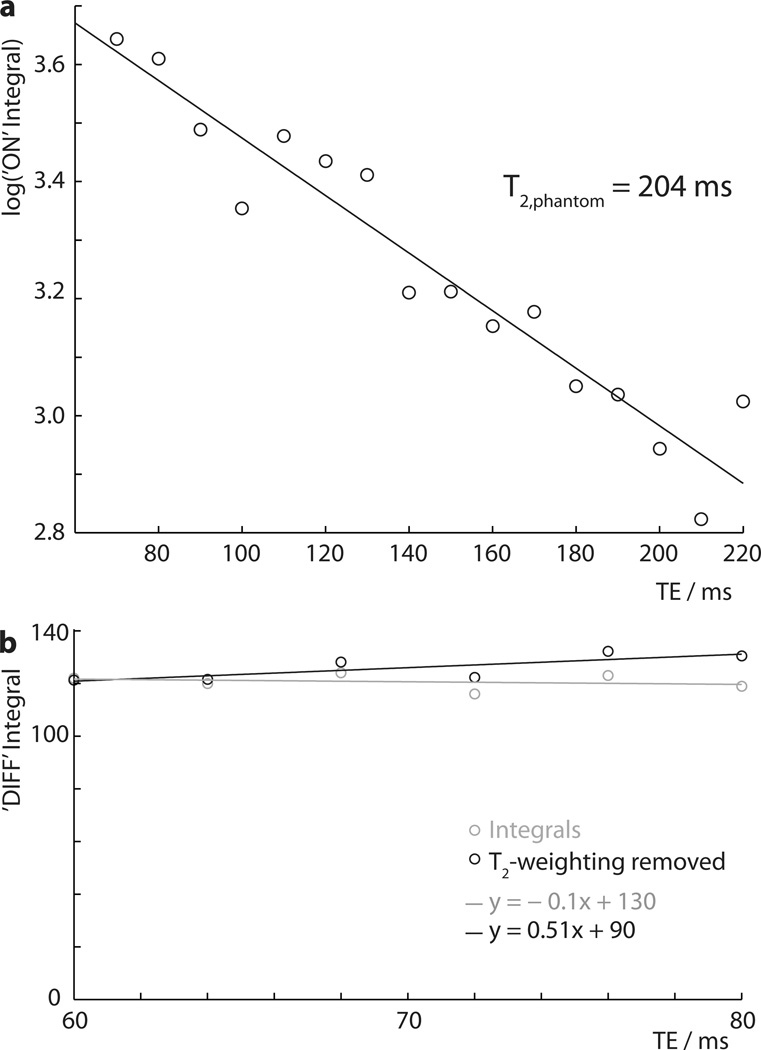
Figure 3.
Spectra recorded as a function of TE in a 10 mM GABA phantom: a) log integral plot of ‘ON’ spectra acquired at a range of TEs to determine the T2,phantom = 204 ms; b) integral plot of ‘DIFF’ (i.e. edited) spectra acquired at TE from 60 ms to 80 ms, showing signal integrals in gray (with T2 weighting) and with T2 relaxation removed in black.

