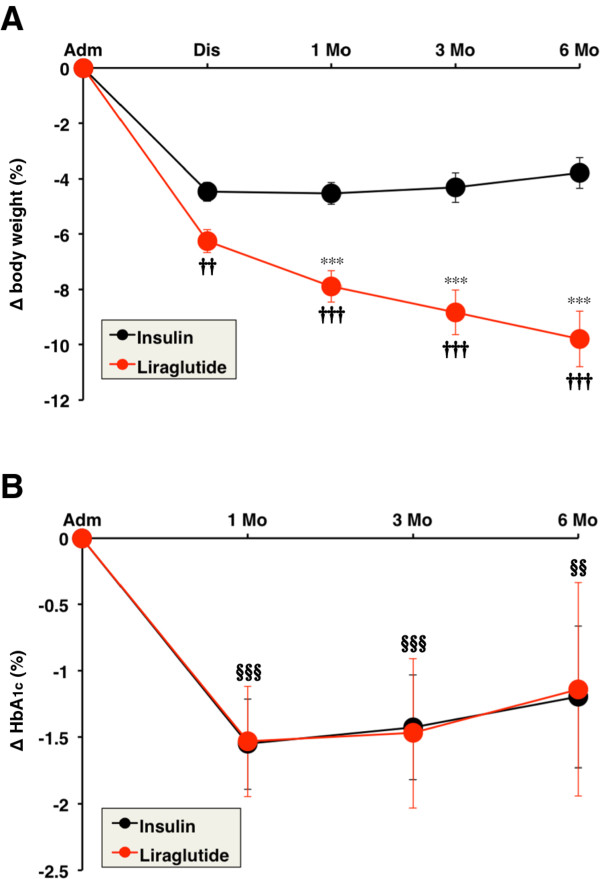
Figure 1.
Serial changes in body weight (A) and HbA1c (B) induced by insulin and liraglutide. Data are mean ± SEM. Adm, admission; Dis, discharge; Mo, month. ***P < 0.001, compared with the values at discharge. †† P < 0.01, ††† P < 0.001, compared with the values of the insulin group. §§ P < 0.01, §§§ P < 0.001, compared with the values at admission.

