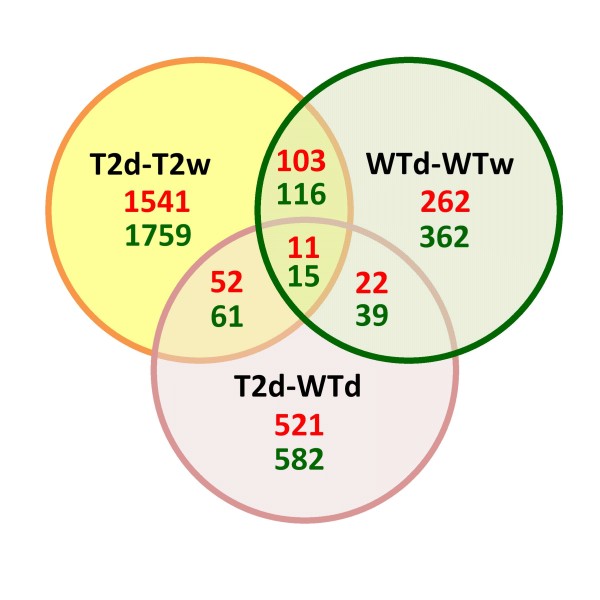
Figure 1.
Venn diagram showing the number of differentially expressed genes in response to drought stress. T2d, TPS1 transgenic line T2 under drought stress; T2w, TPS1 transgenic line T2 under irrigation; WTd, wild-type plant under drought stress; WTw, wild-type plant under irrigation. The numbers of up-regulated genes are shown in red, while the numbers of down-regulated genes are shown in green.

