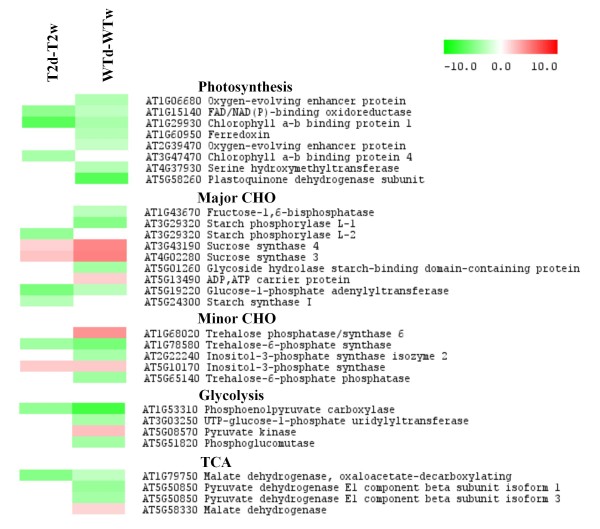
Figure 3.
Heatmap of differentially expressed genes associated with photosynthesis and carbohydrate metabolism. The expression ratios of the genes in the T2d versus T2w and WTd versus WTw comparisons are shown as coloured rectangles and were visualised in the Multiple Experiment Viewer (MeV) software. The colour scale indicates the expression ratios as log2 values, with red and green colours for up- and down-regulated genes, respectively. T2d, TPS1 transgenic line T2 under drought stress; T2w, TPS1 transgenic line T2 under irrigation; WTd, wild-type plant under drought stress; WTw, wild-type plant under irrigation.

