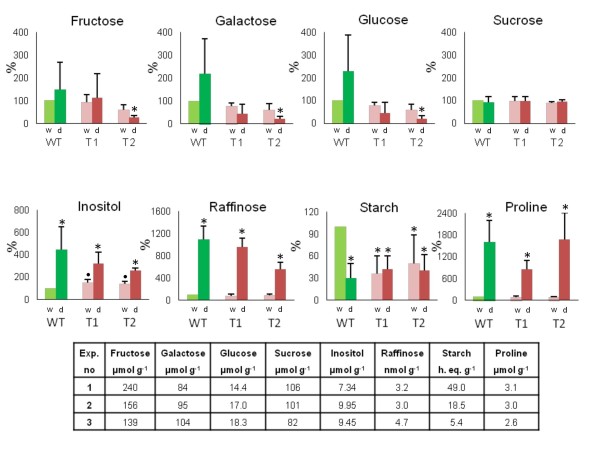
Figure 5.
Relative amounts of sugars, starch and proline in wild-type (WT) andTPS1transgenic (T1, T2) leaves compared to the well-watered WT control. Bars and error bars represent the mean ± SE derived from three independent experiments. Asterisks and dots denote significant differences at the P = 0.01 and P = 0.05 ( t test) levels, respectively, as compared with the well-watered WT control. The absolute concentration of the different compounds in well-watered WT leaves in three independent experiments is shown in a table. Concentrations are calculated relative to dry weights (DW). The concentration of starch is given in hexose equivalents (h. eq.) g-1 DW. The high variation in leaf metabolite and starch content might be explained by the small differences in day length, light intensity and temperature in the greenhouse during the three consecutive plant tests, as environmental conditions can strongly influence metabolite content and starch accumulation in leaves [30]. Therefore, concentrations of compounds in the well-watered WT leaves were regarded as 100% for comparison with other samples originated from the same plant test. Mean ± SE of the percentage values obtained from the three consecutive plant tests were calculated and are presented by bars and error bars.

