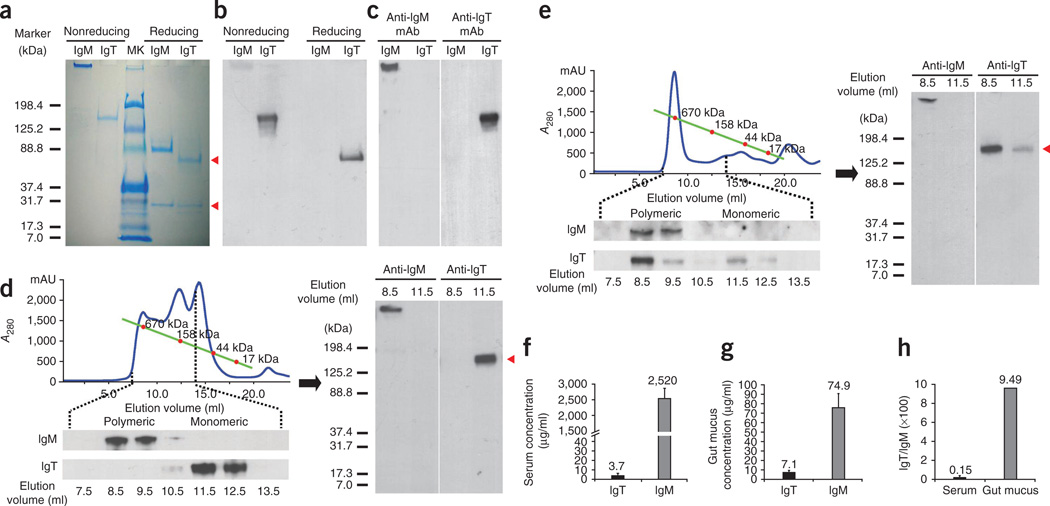
Figure 1.
Purification and structural characterization of IgT. (a) Coomassie blue staining of purified serum IgM and IgT (2 µg) resolved by SDS-PAGE. Red arrowheads indicate heavy and light chains of IgT. Left margin, molecular size in kilodaltons (kDa). (b,c) Immunodetection of IgM and IgT (~0.2 µg) with a polyclonal antibody (b) and mAb (c, right) to trout IgT or an IgM-specific mAb (c, left). (d,e) Fractionation of serum (0.5 ml; d) or gut mucus (0.5 ml; e) by gel filtration (top left), followed by immunoblot analysis of the fractions with IgM- and IgT-specific mAbs (below). Right, 4–15% SDS-PAGE of gel-filtration fractions corresponding to elution volumes of 8.5 ml and 11.5 ml under nonreducing conditions, followed by immunoblot analysis with mAb to trout IgM or IgT. Red arrowheads indicate monomers. A280, absorbance at 280 nm. (f,g) Immunoblot and densitometric analysis of the concentration of IgM and IgT in serum (f) and gut mucus (g); n = 10–15 fish. (h) Ratio of IgT to IgM in serum and gut mucus, calculated from the values in f and g. Numbers above bars (f–h) indicate mean. Data are representative of at least three independent experiments (mean and s.e.m. in f,g).

