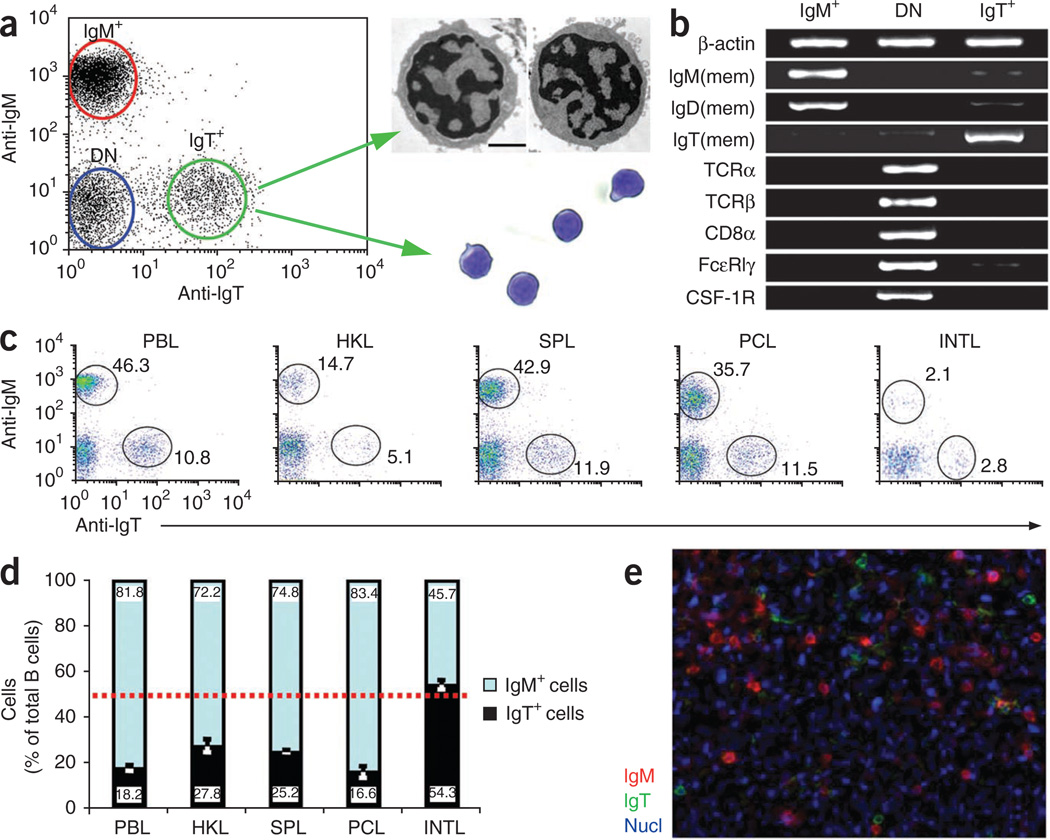
Figure 2.
Identification of a previously unknown B cell lineage that expresses only surface IgT. (a) Flow cytometry (left) of blood leukocytes double-stained with IgM- and IgT-specific mAbs (n = 5 fish), and transmission electron microscopy (top right) and Giemsa staining (bottom right) of sorted IgT+ B cells. Scale bar, 2 µm (top right); original magnification (bottom right), ×40. (b) Gene-expression profiles of sorted IgM+ cells, IgM− IgT− double-negative cells (DN), and IgT+ cells among blood leukocytes (n = 5 fish). β-actin, loading control; IgM(mem), IgD(mem) and IgT (mem), membrane forms of IgM, IgD and gT heavy chains; TCRα and TCRβ, T cell antigen receptorα- and β-chains; CSF-1R, receptor for colony-stimulating factor 1. (c) Flow cytometry of leukocytes from peripheral blood (PBL), head kidney (HKL), spleen (SPL), peritoneal cavity (PCL) and intestine (INTL). Numbers adjacent to outlined areas indicate percent IgM+ cells (top left) or IgT+ cells (bottom right). (d) Frequency of IgM+ and IgT+ cells among total B cells (n = 15 fish). Red dashed line indicates 50%. (e) Immunofluorescence staining for IgM (red) and IgT (green) in a cryosection of rainbow trout spleen; nuclei (Nucl; blue) are stained with the DNA-intercalating dye DAPI (isotype-matched control antibodies, Supplementary Fig. 3a). Original magnification, ×20. Data are representative of at least three independent experiments (mean and s.e.m. in d).

