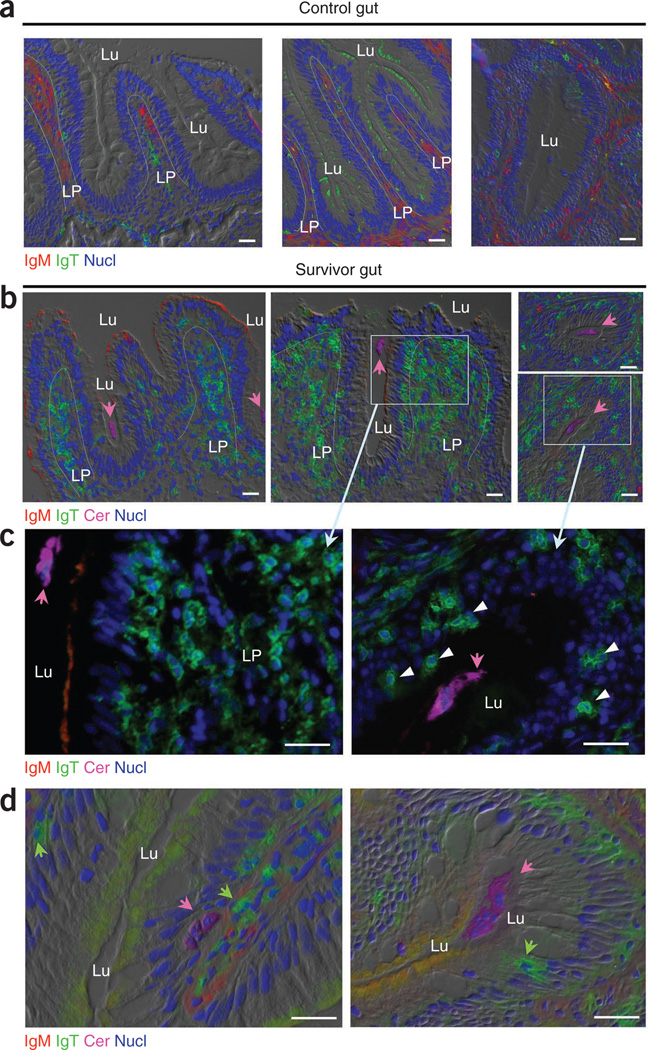
Figure 5.
Accumulation of IgT+ B cells in the GALT of fish that survived infection with C. shasta. Differential interference contrast images of immunofluorescence staining of trout gut cryosections from uninfected control fish (a) and fish that survived infection with C. shasta (b–d; n = 5 per group), stained for IgM (red), IgT (green) and C. shasta (Cer; magenta); nuclei are stained with DAPI (isotype-matched control antibody staining, Supplementary Fig. 3b). Blue dotted lines in a,b outline the border of the lamina propria (LP); magenta arrows point to the parasite located in the gut lumen (Lu). (c) Enlarged images of the areas outlined in b, without differential interference contrast, showing infiltrating IgT+ B cells in the gut lamina propria (left) or epithelium (white arrowheads, right). (d) Localization of a parasite in the gut epithelium (left) or lumen (right); green arrows indicate IgT+ B cells that seem to be secreting IgT. Scale bars, 20 µm. Data are representative of at least three independent experiments.

