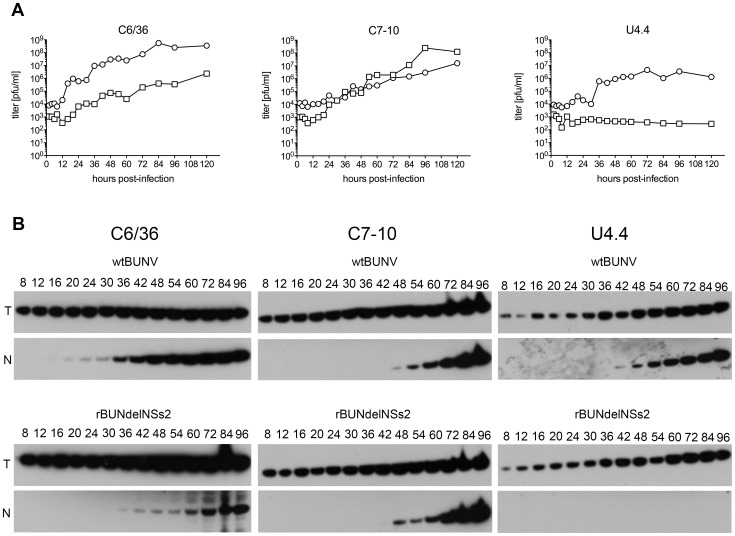
Figure 2. Growth of wtBUNV and rBUNdelNSs2 in Aedes albopictus cell lines.
A. Growth curves. C6/36, C7-10 and U4.4 cells were infected at an MOI of 1 PFU/cell. At the indicated time points, supernatants were collected and viral titres were determined by plaque assay. B. Viral N protein expression. Cells were infected at an MOI of 1 and at the indicated time points (hpi), cells were lysed, and proteins separated by 12% SDS-PAGE. The proteins were transferred to a membrane and incubated with anti-BUNV N protein (N) or anti-tubulin (T) antibodies.

