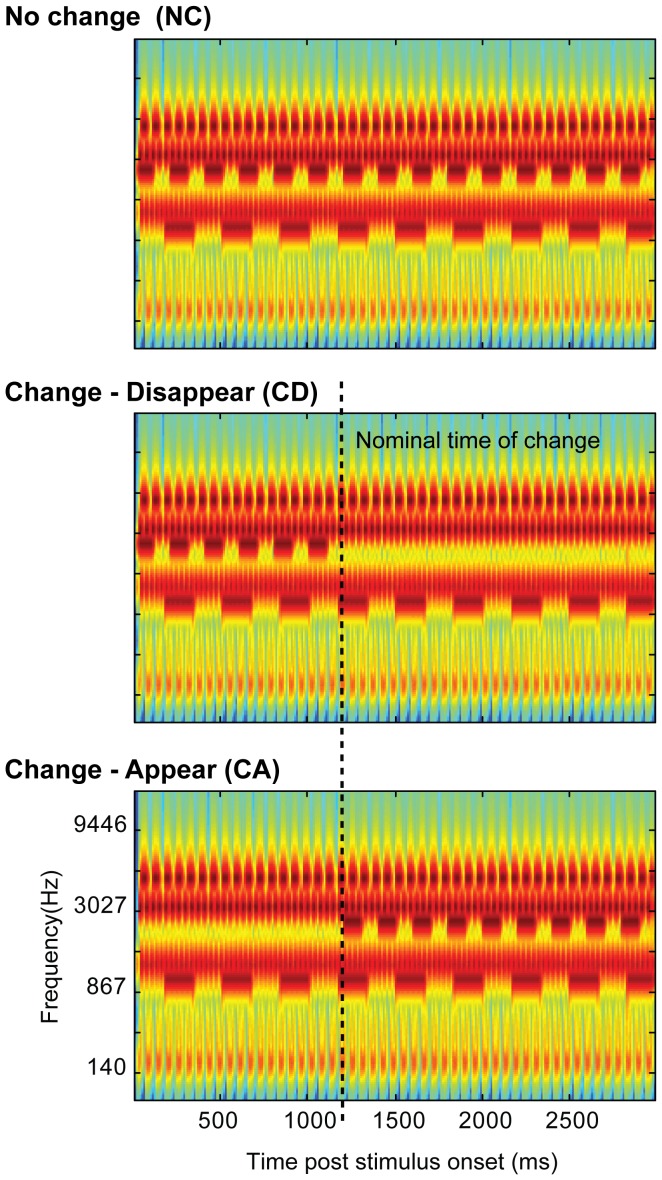
Figure 1. Example of the experimental stimuli.
A: ‘no-change’ (NC) stimulus with six components. B and C show the ‘change-disappear’ (CD) and ‘change-appear’ (CA) variations. Dashed lines show the nominal change time. The plots represent ‘auditory’ spectrograms, generated with a filterbank of 1/ERB wide channels [14] equally spaced on a scale of ERB-rate. Channels are smoothed to obtain a temporal resolution similar to the Equivalent Rectangular Duration [41].

