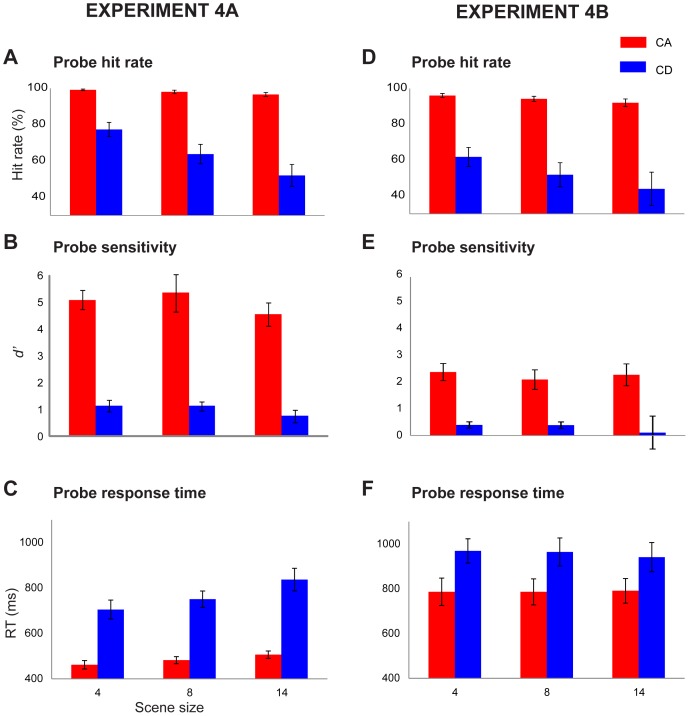
Figure 5. Results of Experiment 4 which tested listeners' ability to identify the component that appeared or disappeared in CA and CD scenes.
In Experiment 4A (left) the probe was identical to the changed component (frequency+AM). In Experiment 4B (right) the probe carrier frequency was fixed at 500 Hz and only the AM varied. Error bars are 1 SE.

