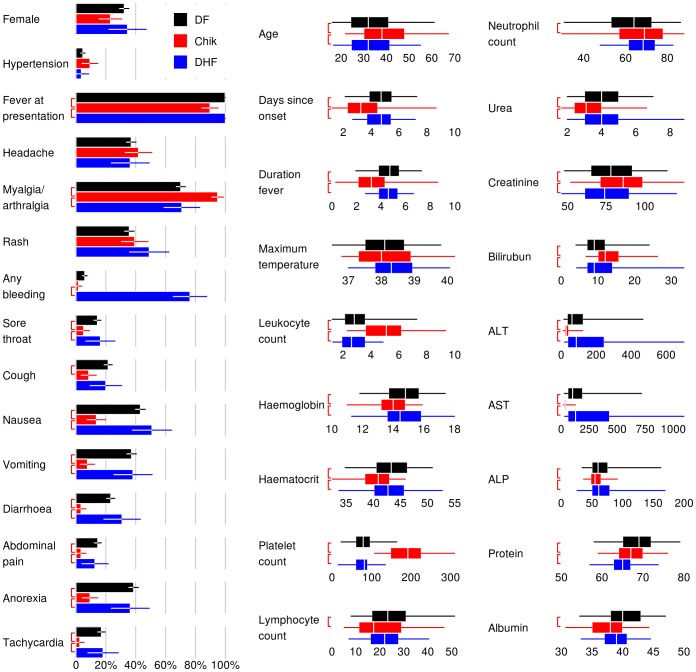
Figure 1. Univariate anaylsis of variables at first presentation to hospital.
The analysis compared between Dengue fever (DF), dengue hemorraghic fever (DHF), and chikungunya (Chik). For binomial variables (first column on the left), bars denote mean percentage with whiskers denoting 95% confidence intervals. For continuous variables (right 2 columns), the box shows the median values (in white) with the interquartile ranges, while the whiskers denote the central 95th percentiles. The red brackets to the left of the bars denote statistically significant comparisons between DF and chikungunya (upper brackers), and DHF and chikungunya (lower brackets). Uniformly distributed jitter of up to ±12 h has been added to the days since onset and duration of fever for graphical purposes. Five DF patients with no temperature measurement are excluded from the maximum temperature panel.

