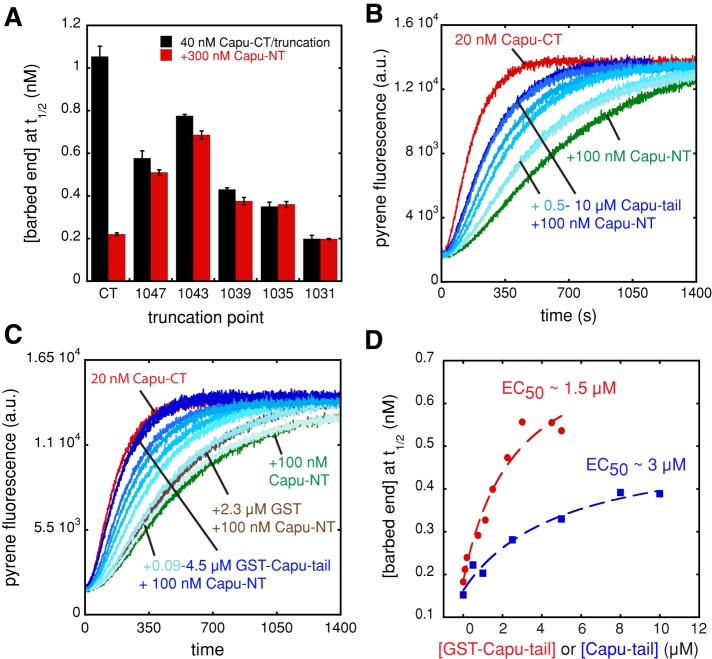
FIGURE 2:
Capu-NT binds to the Capu-tail region. (A) Capu-NT does not inhibit C-terminally truncated Capu-CT. The bar graph shows the barbed-end concentrations at t1/2 in the presence of 40 nM Capu-CT or truncations of the construct ending at the residues indicated, alone (black) or with 300 nM Capu-NT added (red). Each bar represents the average of three experiments (error bars, SD). (B) Capu-tail relieves inhibition by Capu-NT. Addition of 0.5–10 μM Capu-tail (shown with increasing shades of blue) to 20 nM Capu-CT plus 100 nM Capu-NT leads to recovery of Capu-CT polymerization activity in a dose-dependent manner. Capu-CT alone (20 nM, red) and with 100 nM Capu-NT (green) are shown. (C) GST–Capu-tail relieves inhibition by Capu-NT. The same experiment as in B but with increasing concentration (0.09–4.5 μM) of GST–Capu-tail. Adding 2.3 μM GST alone to the Capu-CT/Capu-NT mix had a weak effect on polymerization (brown). (D) From the pyrene assays in B and C, the barbed-end concentration at t1/2 was calculated for each concentration of Capu-tail or GST–Capu-tail (concentration of the GST-tagged monomer is indicated) and graphed, yielding an estimated EC50 of ∼3 μM for Capu-tail and ∼1.5 μM for GST–Capu-tail. The dashed red and blue lines are drawn to guide the eye.

